TL;DR
Shopify conversion rate usually means the percentage of online store sessions that end in an order.
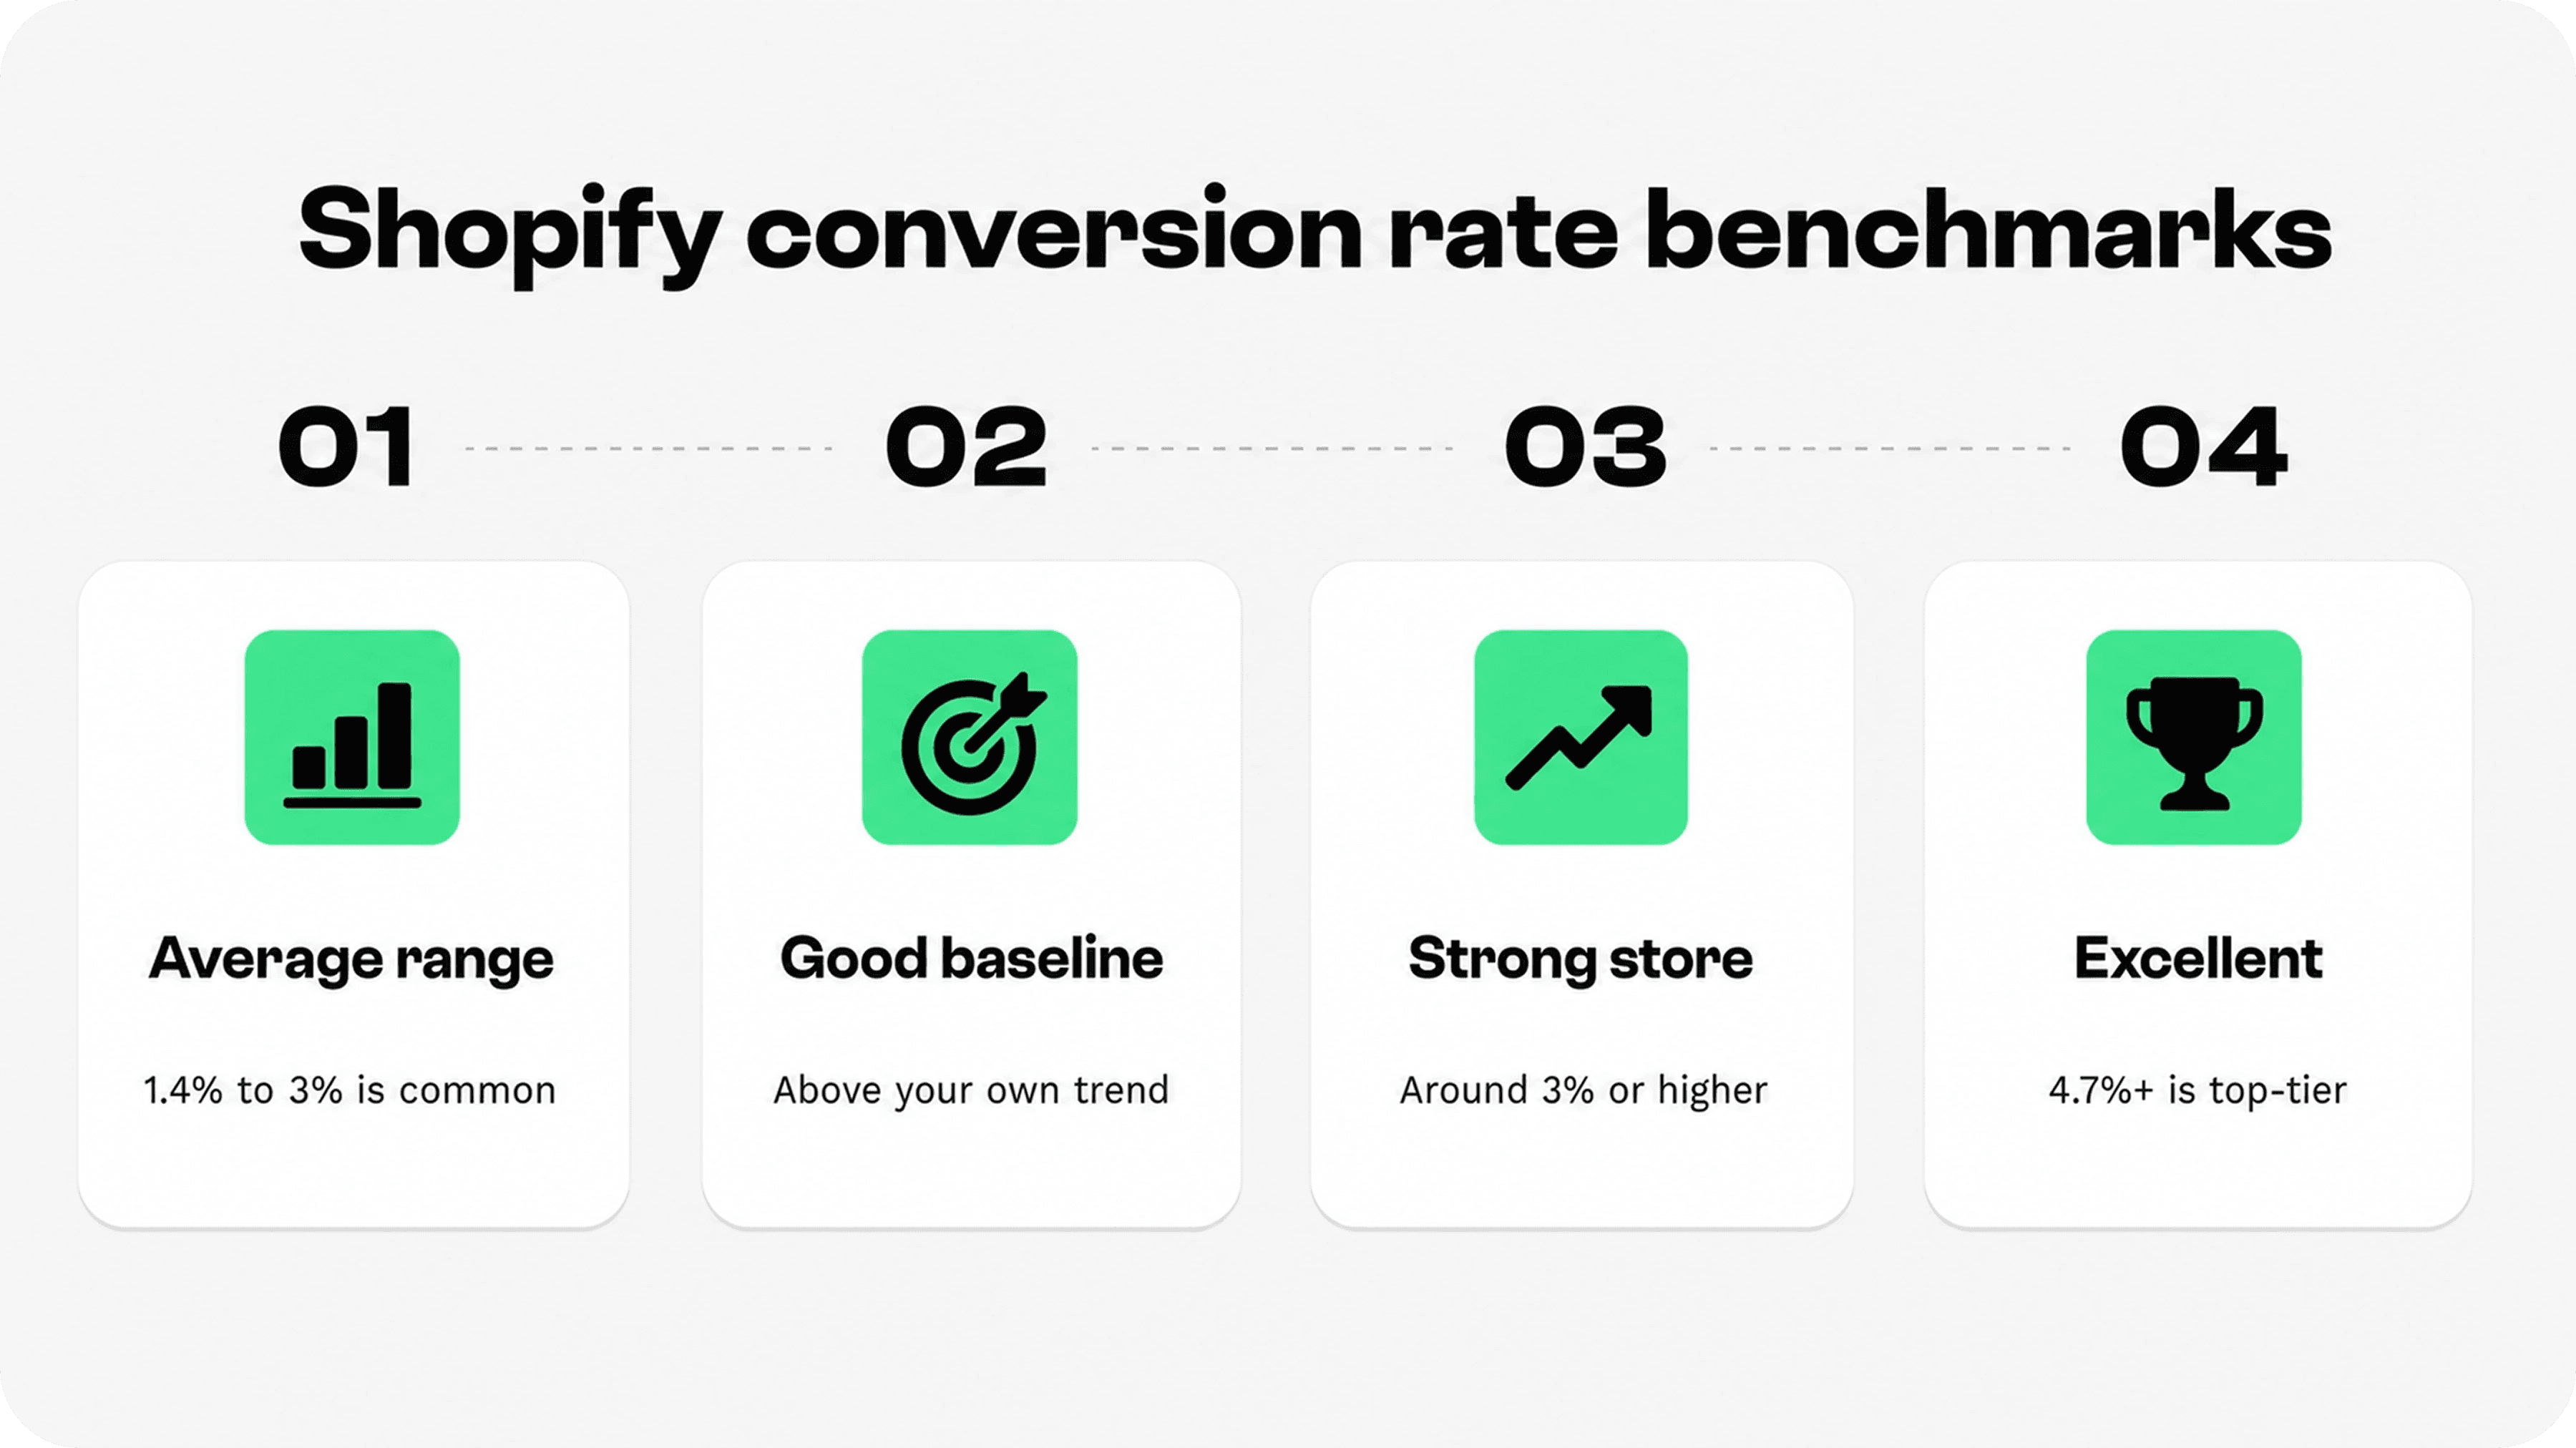
Public benchmarks vary, but a practical Shopify range is about 1.4% to 3% for many stores.
A good conversion rate on Shopify is often 3% or higher, while 4.7%+ is commonly treated as top-tier performance.
Your own trend matters more than a broad average because product price, category, traffic source, mobile share, and repeat-customer mix can change the number dramatically.
Interpret conversion rate with add-to-cart rate, checkout completion, average order value, profit margin, and revenue per visitor.
What Shopify conversion rate means
Shopify conversion rate is the percentage of store visits that turn into a completed purchase. Shopify often calls this metric "online store conversion rate", while Google Analytics and many CRO tools call it ecommerce conversion rate, transaction rate, order rate, or website conversion rate. Shopify's ecommerce conversion rate guide describes the basic formula as orders divided by visits.
In practical terms, if your Shopify store gets 10,000 sessions in a month and 200 of those sessions produce an order, your Shopify conversion rate is 2%. The formula is simple:
Conversion rate = orders / sessions x 100
The sessions part matters. A shopper who visits twice before buying can create two sessions. A user-based conversion rate will usually look higher than a session-based conversion rate, so do not compare numbers unless you know how each tool calculates them.
Shopify's marketing performance documentation also describes conversion rate in traffic reports as the percentage of sessions that resulted in an order. Source: Shopify Help Center.
That is why a merchant should avoid mixing Shopify Analytics, GA4, ad platforms, and app dashboards as if they all show the same thing. Pick one main source of truth for trend tracking, then use other tools to diagnose why the trend changed.
Shopify conversion rate benchmarks
The short answer: a good Shopify conversion rate is usually somewhere above your own recent baseline, and a strong public benchmark is around 3% or higher. But broad benchmarks should be treated as orientation, not a pass-fail score.
For Shopify-specific benchmarking, Littledata reports an average Shopify conversion rate of 1.4%, with stores above 3.2% in the top 20% and stores above 4.7% in the top 10% of its benchmark set. Shopify's own 2026 conversion-rate guide also notes that global ecommerce averages often sit around 2% to 3%, depending on the dataset and context.
Those numbers give merchants a useful starting point, but they should not replace store-specific analysis. A high-AOV furniture store, a low-price consumables store, and a fast-moving fashion brand can all be healthy at different conversion rates.
Conversion rate | How to read it | What to check next |
|---|---|---|
Below 1% | Often weak for a typical Shopify store, unless the product is expensive, complex, or early-stage. | Traffic quality, product-market fit, mobile UX, product clarity, trust signals, and checkout friction. |
1% to 2% | Common for many stores, especially with cold traffic, high mobile share, or considered purchases. | Segment by channel and device before judging. Look for one obvious funnel drop-off. |
2% to 3% | A solid working range for many Shopify stores and close to broad ecommerce averages. | Improve revenue per visitor, not only conversion rate. Watch AOV and margin. |
3% to 4.7% | Strong performance for many Shopify merchants and often above broad averages. | Protect what works, then test product-page clarity, cart reassurance, and checkout speed. |
4.7%+ | Excellent in many Shopify benchmark sets, though easier in some categories than others. | Confirm the rate holds across profitable traffic, not only email, returning customers, or sale periods. |
Why average Shopify conversion rates differ between stores
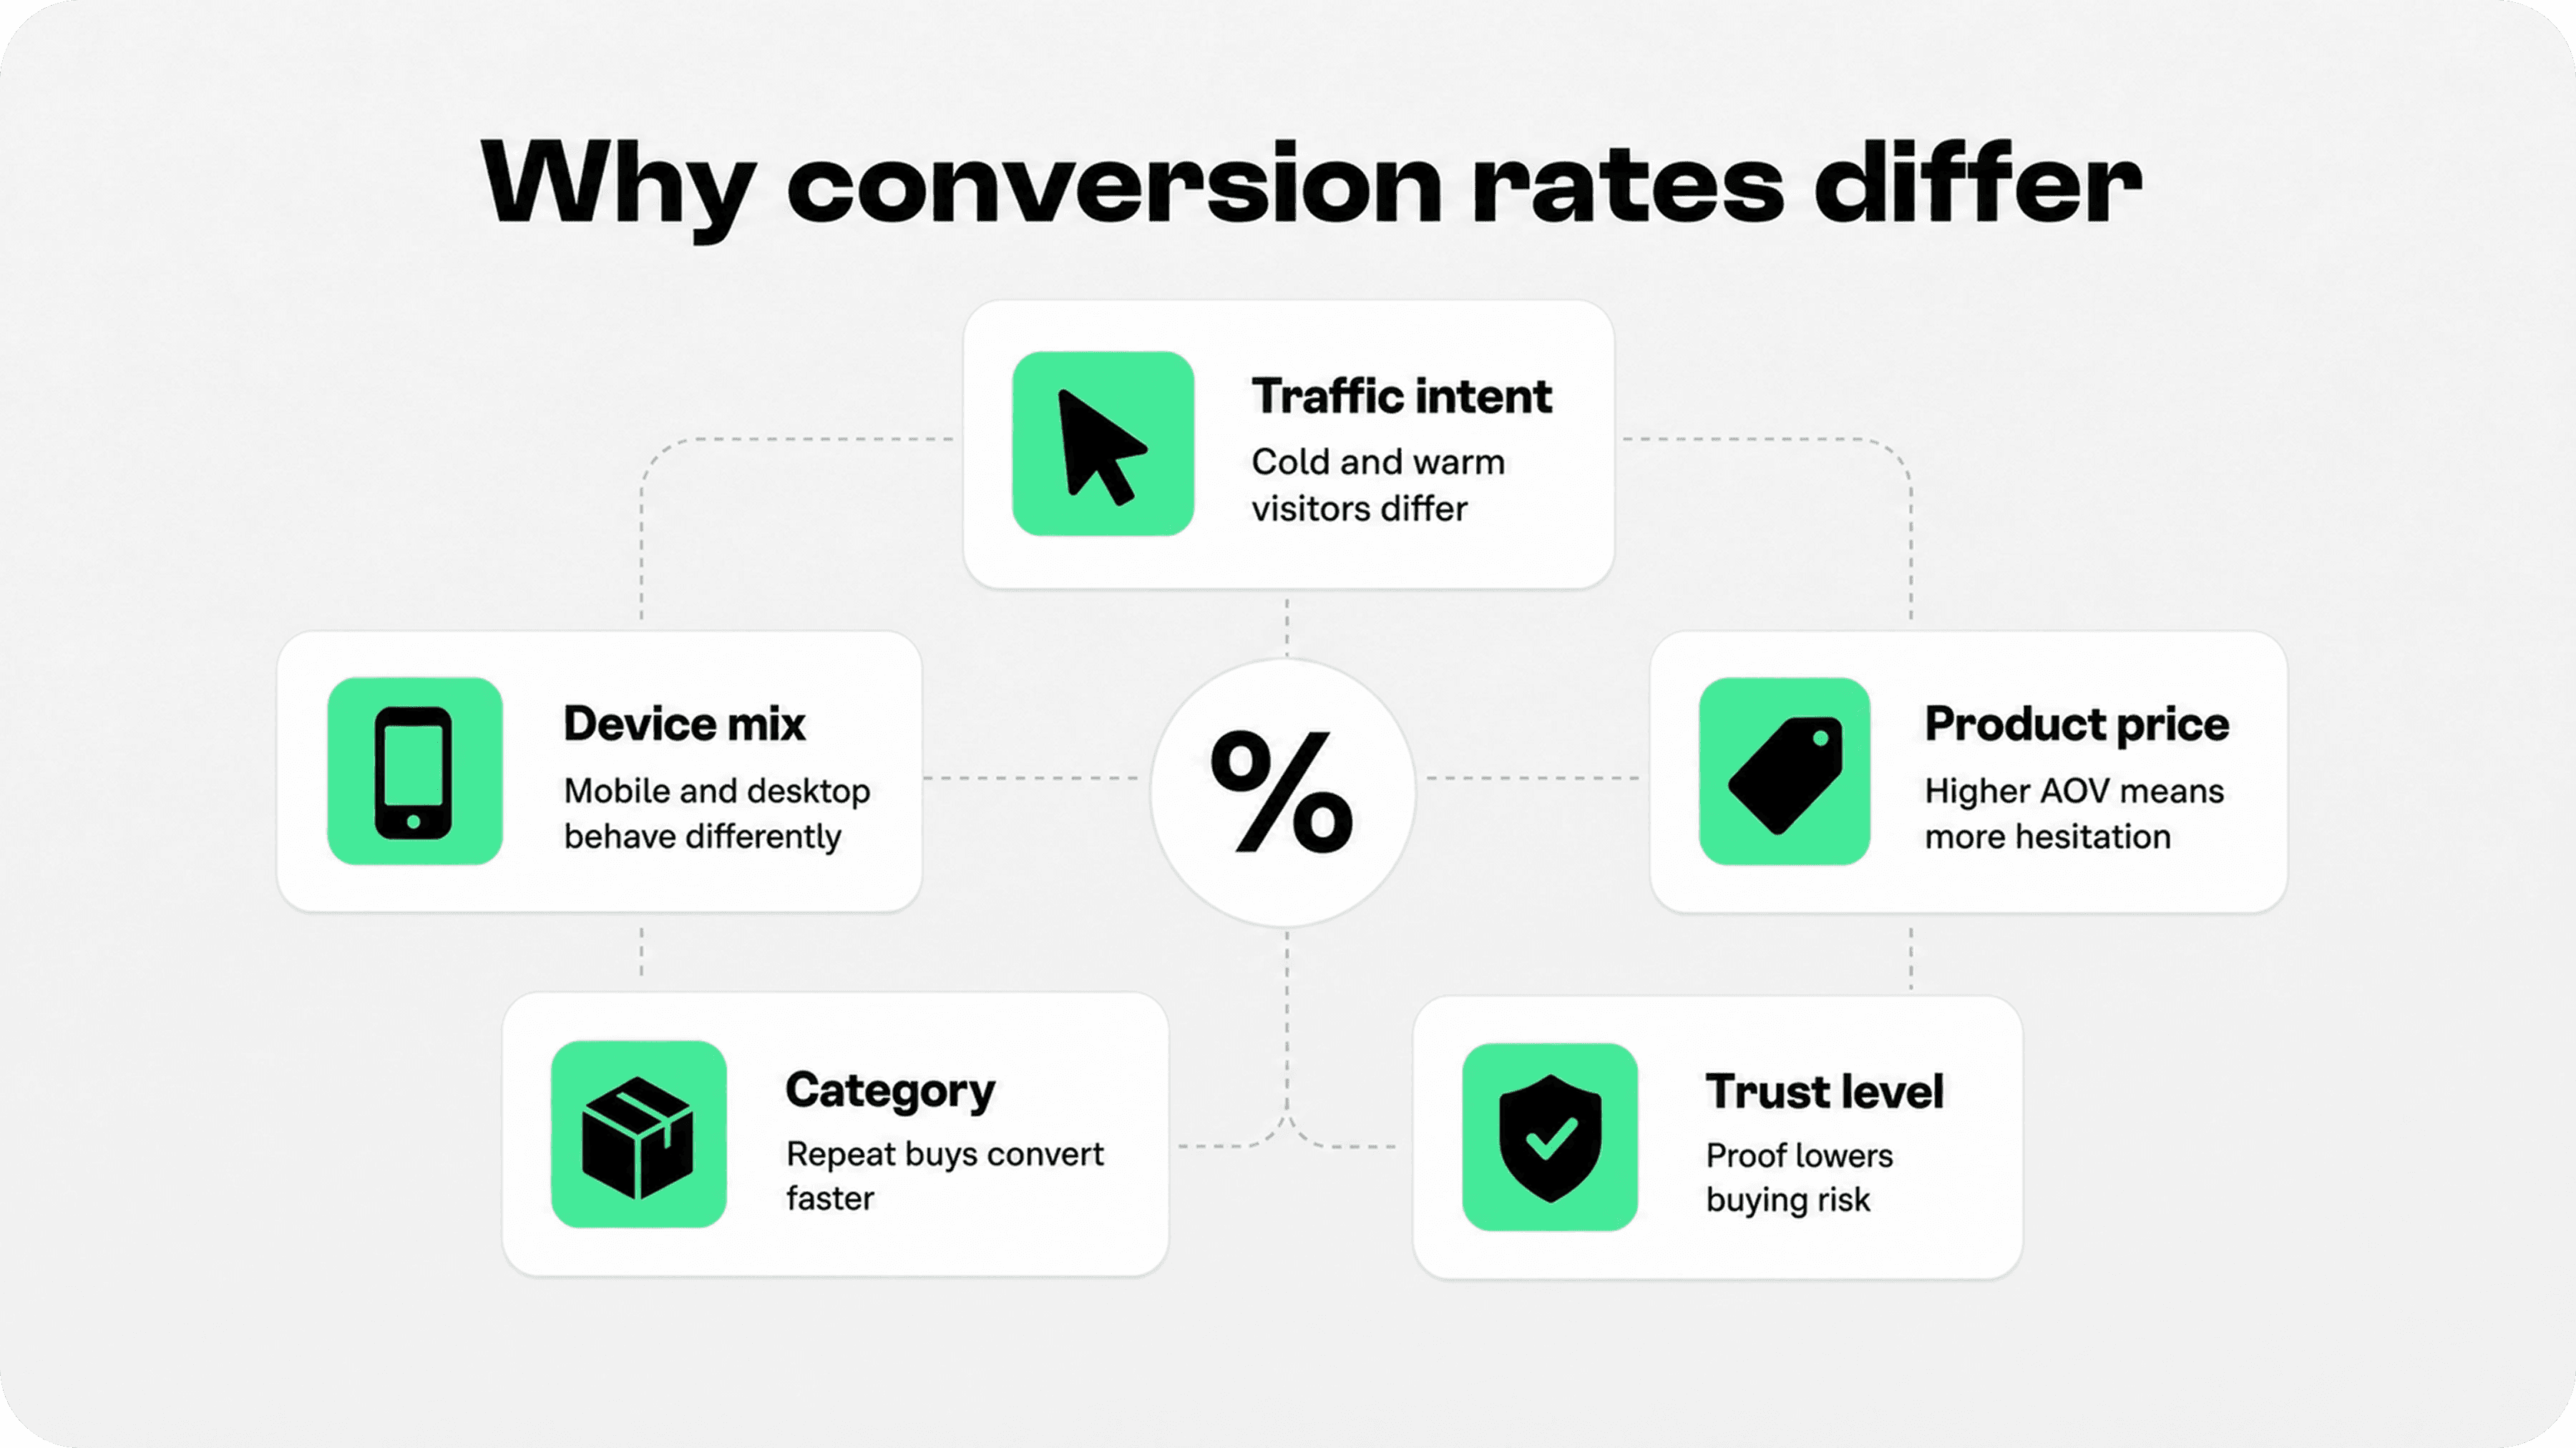
Two Shopify stores can both have a 2% conversion rate and be in very different positions. One might be wasting paid traffic. Another might be selling expensive products profitably with a long buying cycle. This is why the phrase average Shopify conversion rate can be useful for orientation but misleading for diagnosis.
The biggest driver is intent. Email subscribers, returning customers, branded search visitors, and retargeting audiences usually know the store already. Cold social traffic, broad paid campaigns, and top-of-funnel blog traffic often include people who are still researching. Blending those sources into one number can hide what is really happening.
Device mix changes the number too. Mobile usually drives more ecommerce sessions, but desktop often converts better because shoppers have more space, fewer distractions, and an easier checkout experience. A store with 80% mobile traffic should not blindly compare itself with a store whose traffic is mostly desktop.
Product economics matter as much as page design. Low-priced repeat-purchase products can convert at a higher rate because the decision feels easier. High-priced, technical, custom, luxury, or gift-driven products may convert lower while still producing healthy revenue per visitor.
Seasonality, discounts, inventory, shipping promises, delivery countries, payment options, brand trust, reviews, product photography, and support quality all affect conversion rate. So does the stage of the store. A new store with little brand proof should not expect the same rate as a repeat-heavy store with thousands of reviews.
How to interpret your own Shopify conversion rate
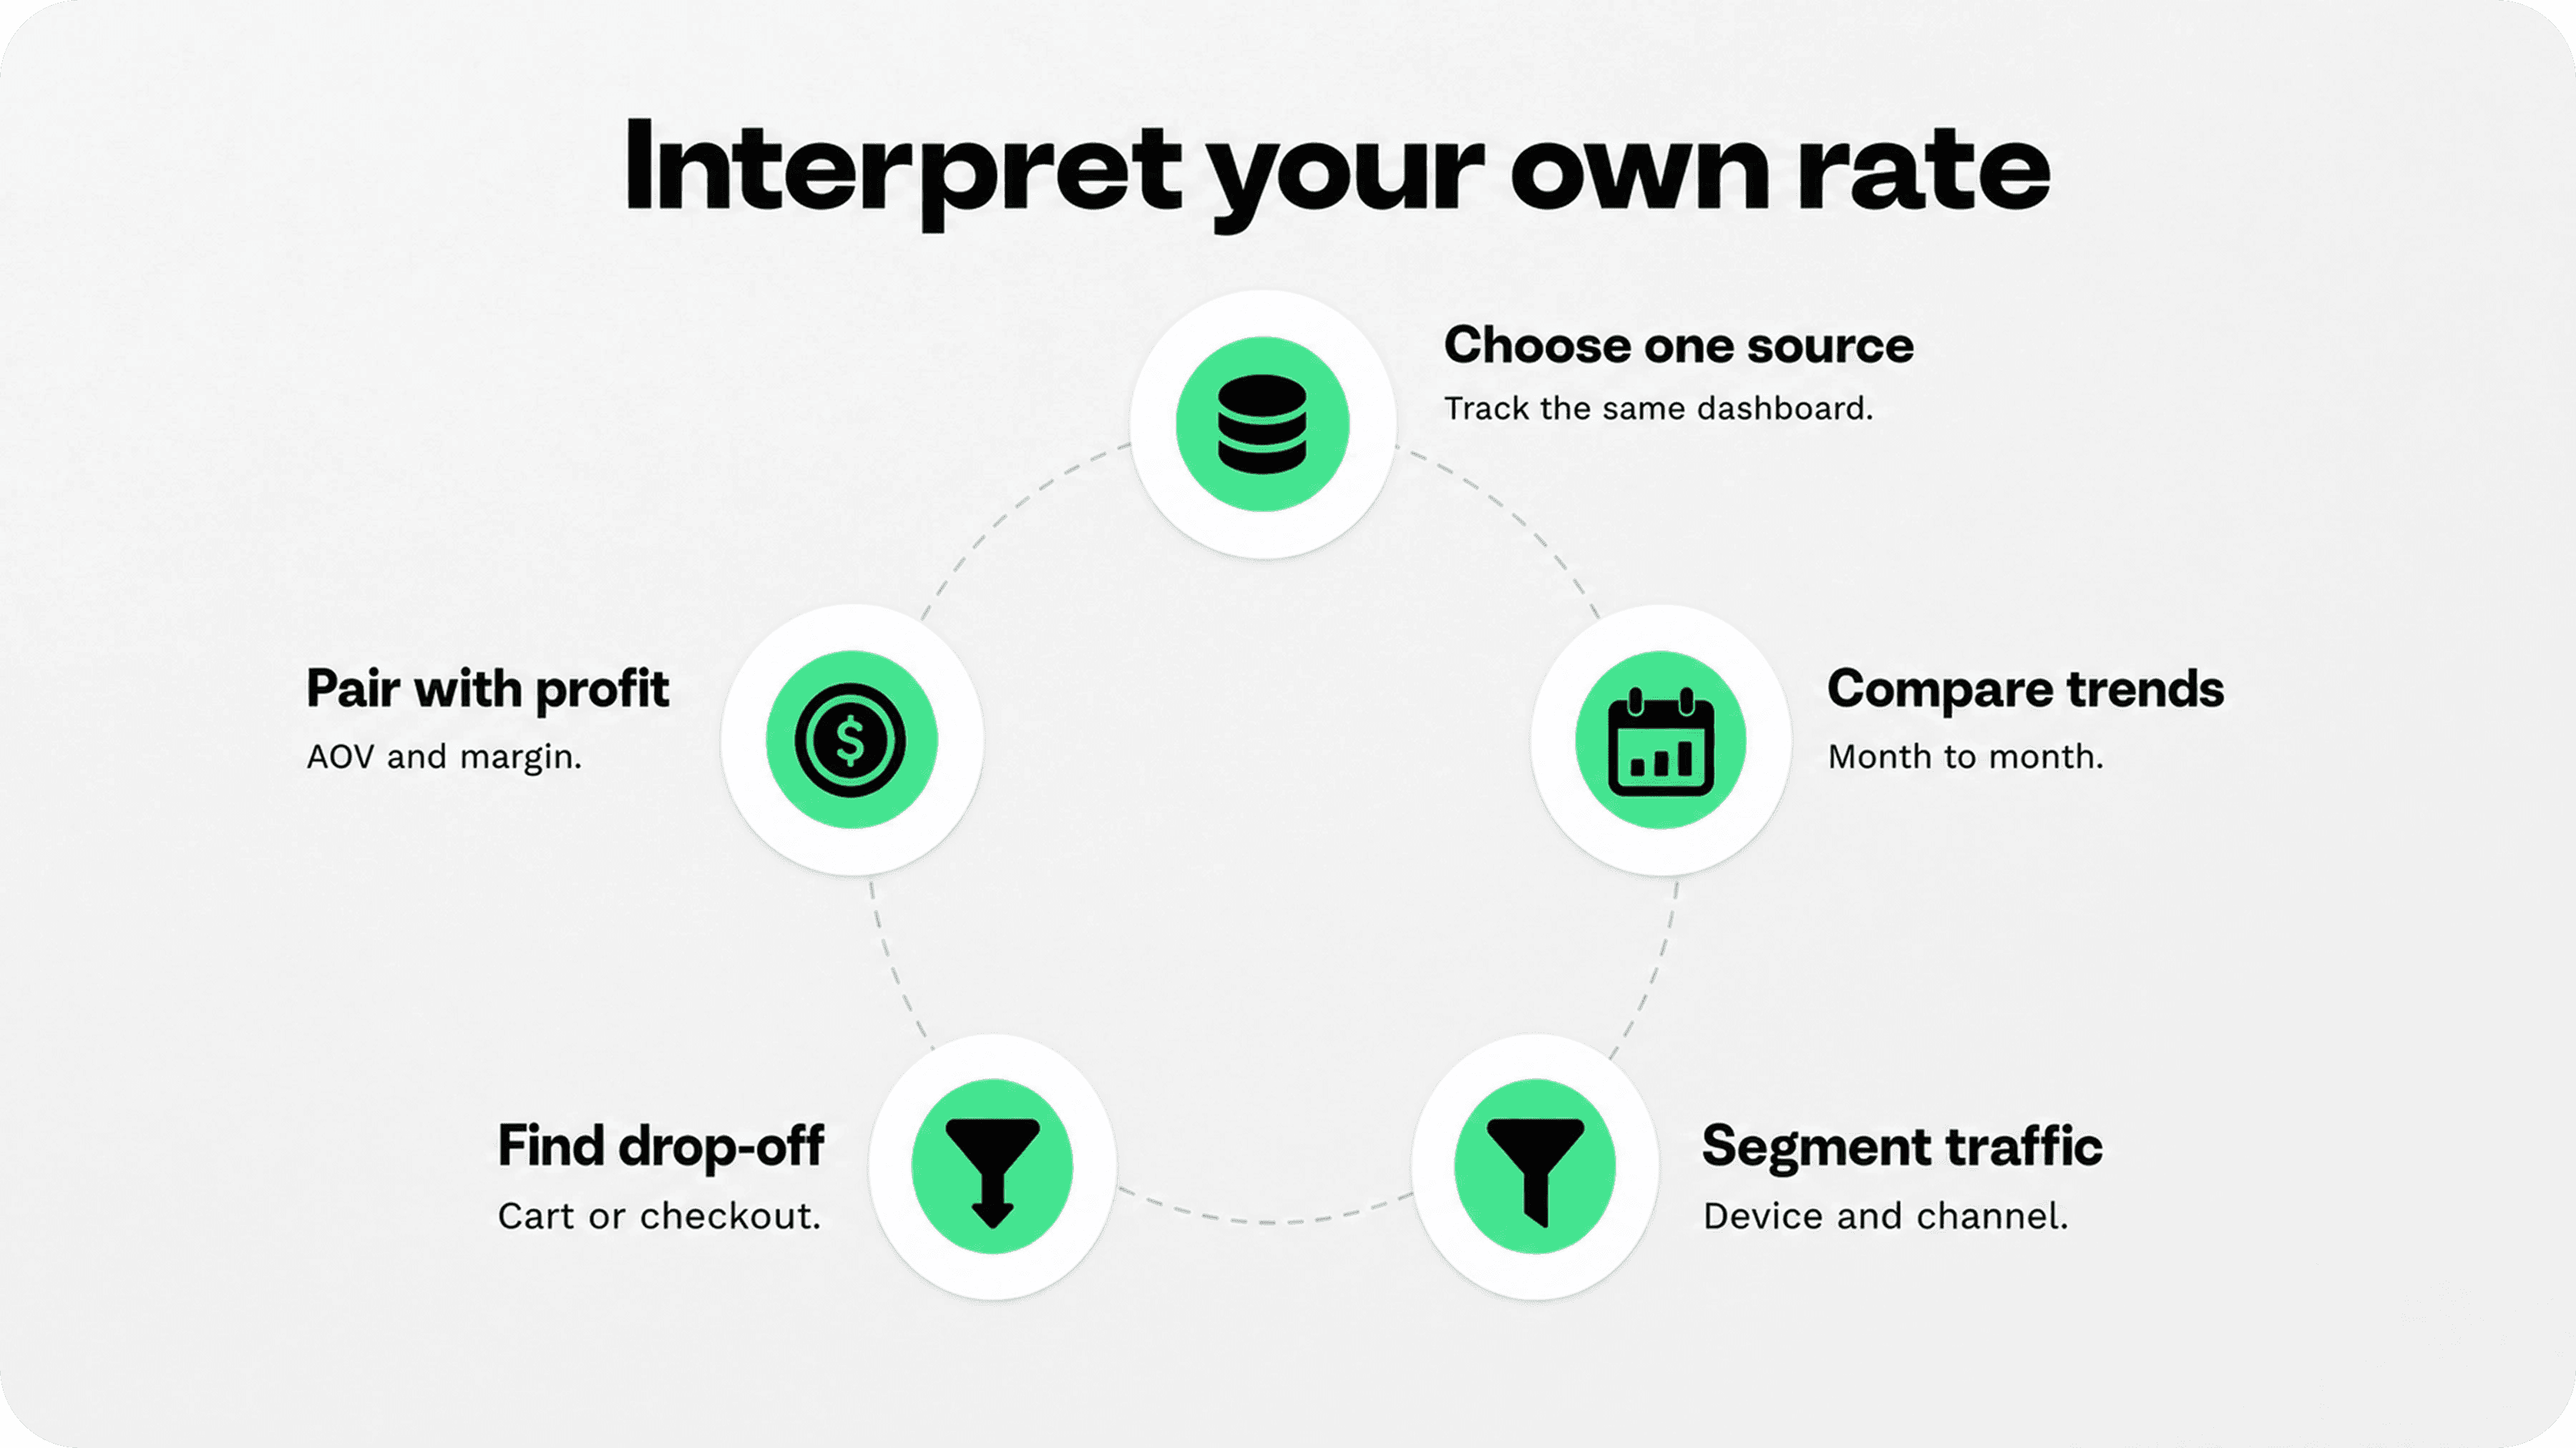
The best benchmark is your own store, measured consistently. Look at your Shopify conversion rate over a meaningful period, then compare it with similar periods instead of reacting to one bad day. Weekly views are useful for spotting technical problems. Monthly views are better for optimization. Quarterly views are better for strategy.
Start with the blended online store conversion rate, then break it down. Look at mobile versus desktop, new versus returning customers, traffic source, country, landing page, product category, and campaign. A storewide 2.1% rate is not very actionable. A mobile paid-social rate dropping from 1.4% to 0.8% after a landing page change is actionable.
Then pair conversion rate with funnel metrics. Add-to-cart rate tells you whether shoppers want the product enough to take the first buying step. Reached-checkout rate shows whether the cart and offer are carrying them forward. Checkout completion shows whether payment, shipping, account creation, trust, or final cost is creating friction.
Finally, include money metrics. A lower conversion rate with a higher average order value can be better than a higher conversion rate with tiny orders and weak margin. Revenue per visitor, contribution margin, customer acquisition cost, and repeat purchase rate tell you whether the conversion rate is helping the business, not just the dashboard.
What to check when your Shopify conversion rate is low
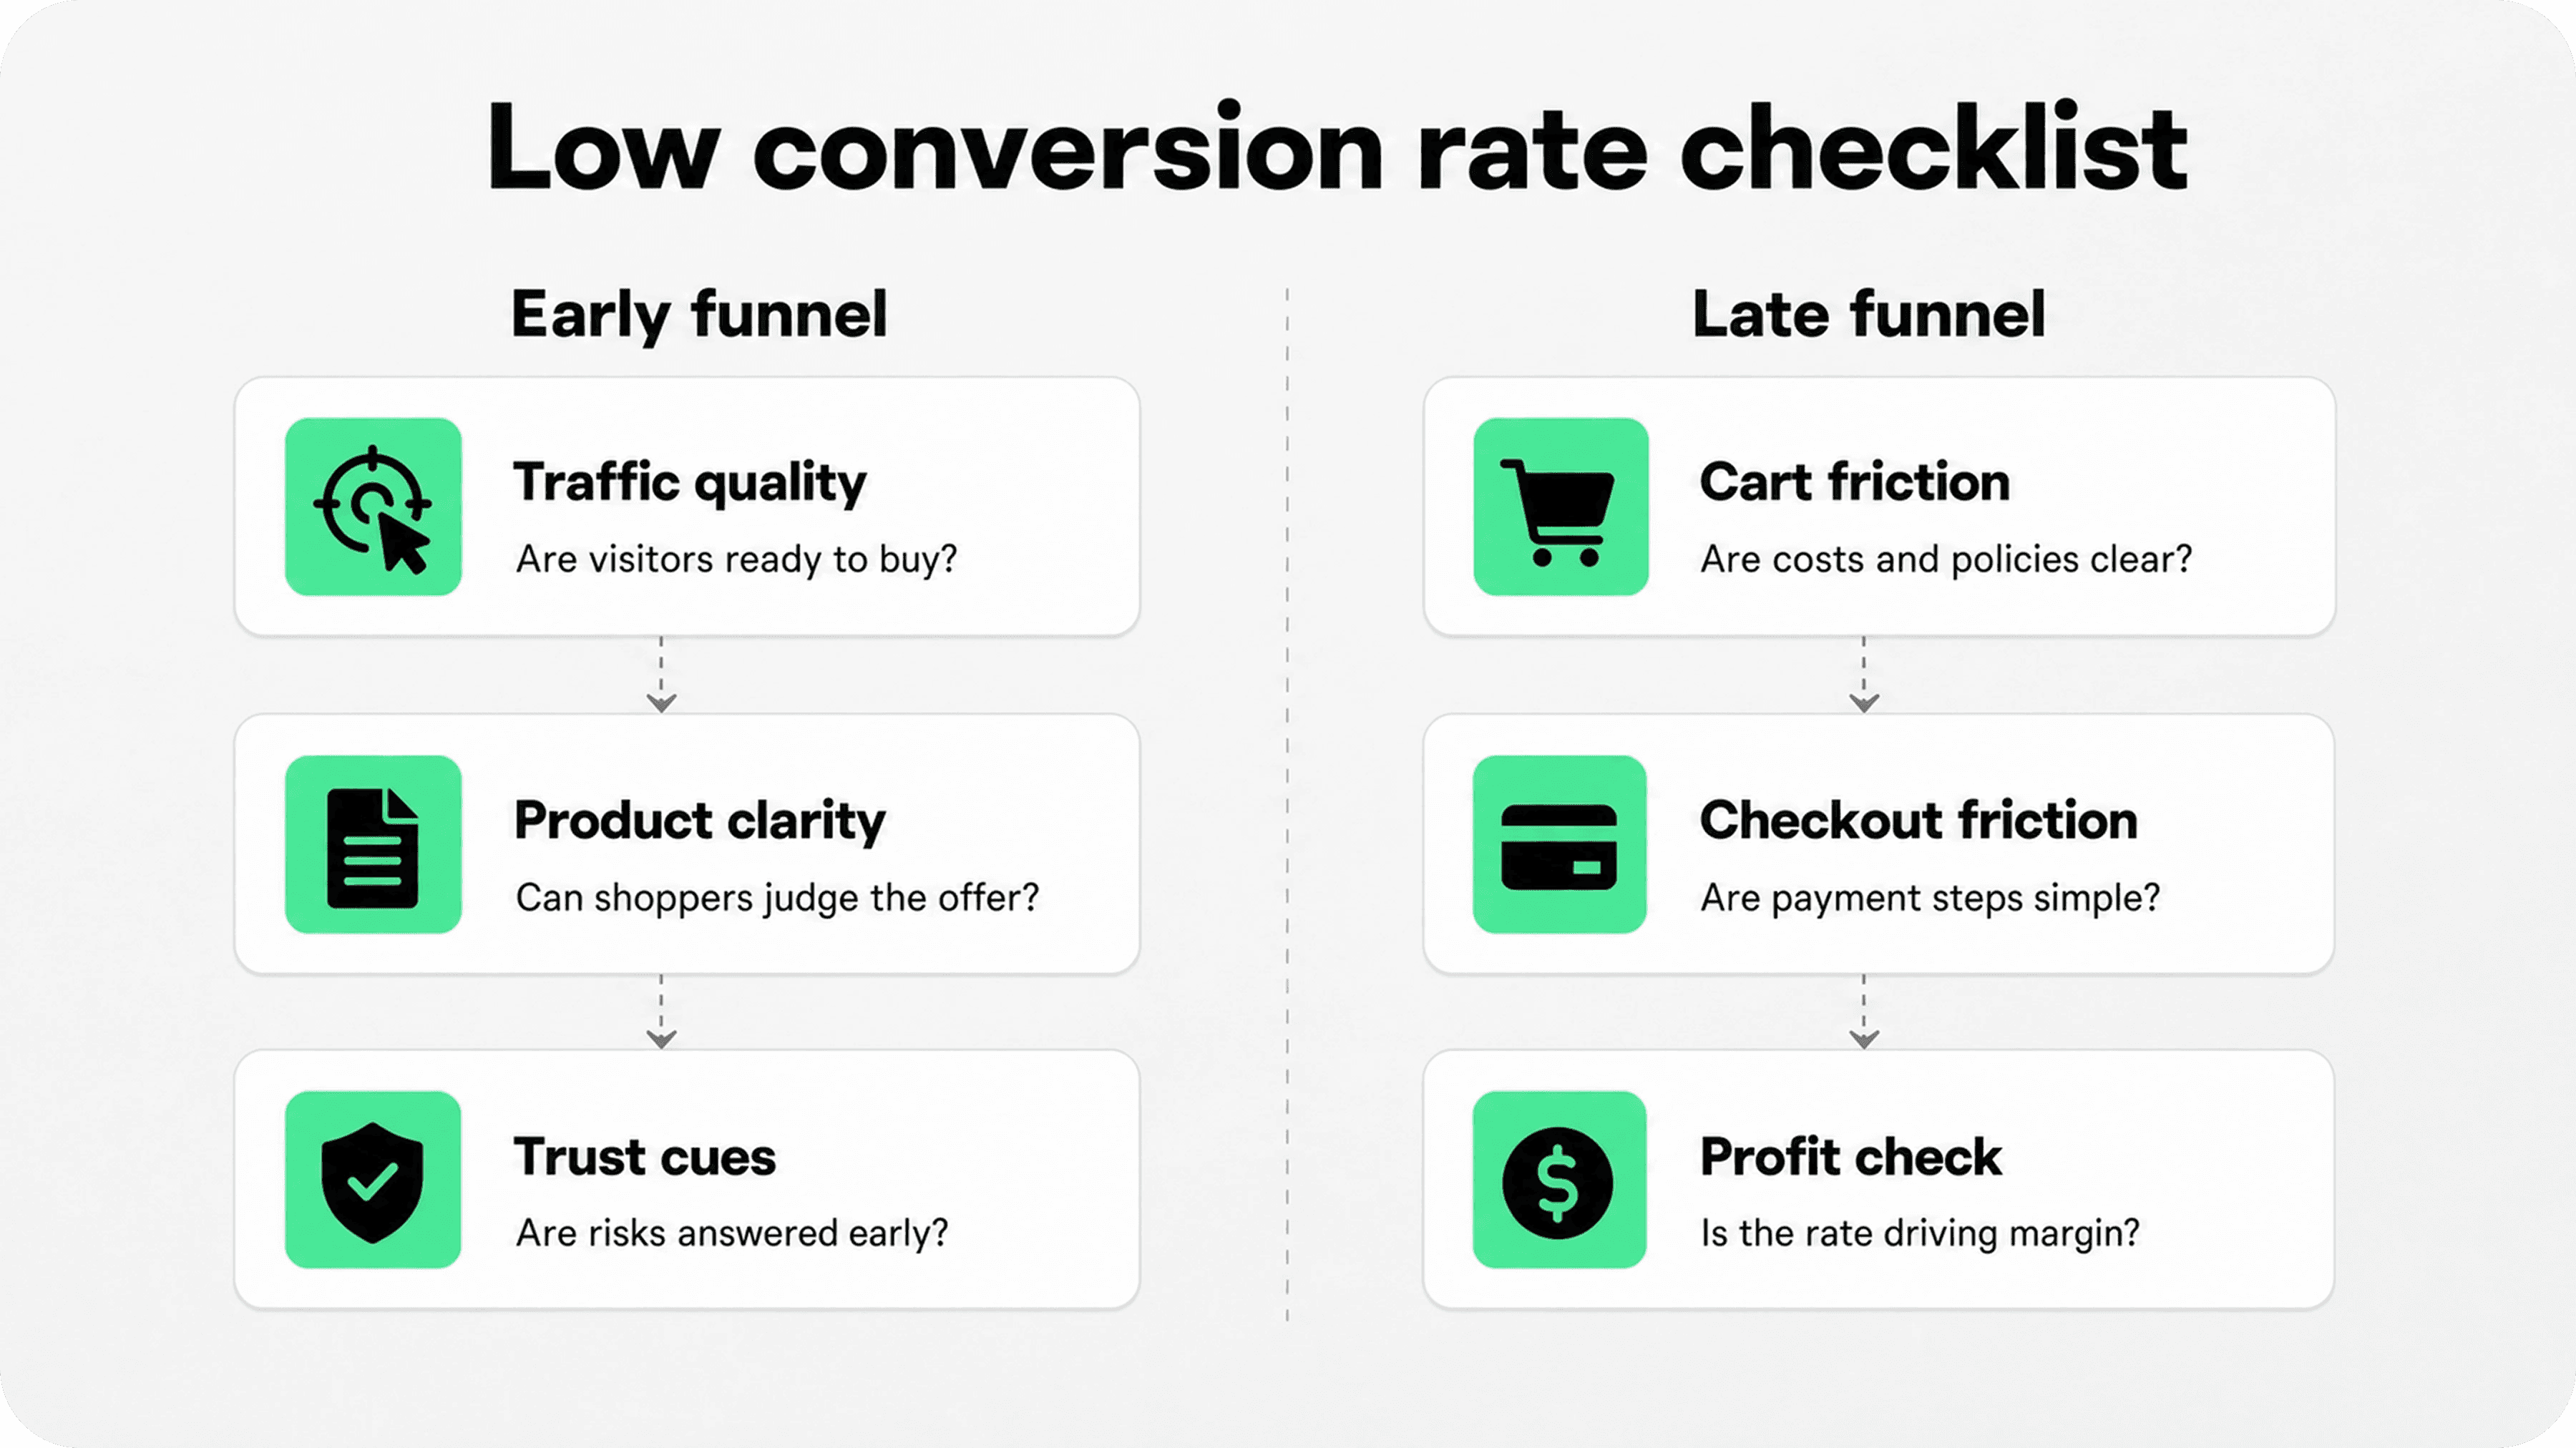
If your Shopify conversion rate is below your benchmark, do not start by adding random popups, badge strips, countdown timers, or discounts. First find where the funnel is leaking.
If visitors do not add to cart
Focus on product-page clarity. Make sure shoppers can understand the product, price, variants, sizing, materials, delivery promise, returns, and main benefit quickly. Weak product photos, vague descriptions, missing reviews, unclear shipping, and hidden policies can all suppress add-to-cart rate.
If add-to-cart is healthy but checkout starts are weak
Look at the cart. The shopper may be hesitating because costs are unclear, payment options are not visible, the cart feels cluttered, or the return policy is hard to find. Snapp's guide to Shopify cart page optimization explains how trust signals near the cart checkout button can answer these concerns before the shopper reaches checkout.
Read more: Shopify Cart Page Optimization: Trust Signals.
If checkout starts are healthy but purchases are weak
Review the checkout experience and final cost. Baymard Institute has repeatedly found that unexpected costs, slow delivery, forced account creation, payment-security concerns, and complicated checkout flows are major reasons shoppers abandon purchases.
Some checkout fixes are operational: shipping rates, delivery speed, payment methods, tax clarity, and support availability. Others are design and messaging: clear policy links, payment reassurance, trust badges, and cleaner cart-to-checkout flow.
If only one channel is weak
Do not redesign the whole store. Check whether that traffic source is bringing the right customers. A low conversion rate from broad paid social may point to targeting, creative, landing-page mismatch, or offer quality. A low conversion rate from email or branded search is more concerning because those visitors should already have higher intent.
How Snapp can help
Snapp fits the trust and clarity layer of conversion-rate improvement. For merchants comparing Shopify apps to increase sales, Snapp Trust Badges & Icons helps add clean trust badges, payment icons, product benefit icons, delivery cues, return reassurance, and simple confidence blocks without rebuilding store templates.
That matters because conversion rate often changes when shoppers feel less risk at the decision point. A clear product page, a calm cart, visible payment options, easy returns, and honest delivery details can make the next click feel safer.
For deeper trust-signal guidance, see Snapp's guides to ecommerce trust signals and Shopify product page optimization.
Final recommendation
A good Shopify conversion rate is one that is improving for the right traffic, profitable for your margins, and healthy compared with stores that sell similar products to similar customers. Use 1.4% to 3% as a practical benchmark range, treat 3%+ as strong, and treat 4.7%+ as excellent, but do not let a generic average replace your own funnel data.
The right question is not only, "What is a good conversion rate on Shopify?" It is, "Which visitors should be converting better, where are they dropping off, and what would make the buying decision clearer or safer?" Answer that, and your Shopify conversion rate becomes a useful operating metric instead of a number that creates anxiety.